
Per Partner Profits: A Practical Guide for Law Firm Leaders
September 1, 2026 · 16 min read · Five Star Placements

Table of contents
In the 2026 Am Law 100 ranking, average profits per equity partner reached $3.59 million, up 14.0% year over year, on aggregate revenue of $178.95 billion. Wachtell, Lipton, Rosen & Katz reported $12.152 million, while Kirkland & Ellis reported $11.121 million in profits per equity partner, according to Sartori Global's analysis of partner economics.
Those figures are striking, but they don't answer the question firm leaders and lateral partners need to ask: what produced the number, and will the underlying economics last? Per partner profits, often called profits per equity partner or PEP, is an accounting average. It can reveal pricing power, practice mix, and operating discipline. It can also conceal partner-class changes, concentration risk, and compensation structures that make the headline figure look stronger than an individual partner's realized income.
The useful approach is to treat PEP as a diagnostic instrument. A ranking tells you where a firm landed. A diagnostic tells you why it landed there, who benefits, and whether the result supports recruiting, retention, and long-term investment.
Table of Contents
- Why Per Partner Profits Matters Now
- How Per Partner Profits Is Actually Calculated
- Benchmarking Per Partner Profits Across the Market
- What Drives Per Partner Profits Up or Down
- When Rising Per Partner Profits Mislead the Reader
- Per Partner Profits as a Recruiting Signal
- Reading Per Partner Profits in Due Diligence
- Turning Per Partner Profits Into a Strategy
Why Per Partner Profits Matters Now
Per partner profits matters because it estimates a firm's economic capacity per partner. The basic measure divides distributable firm profit by the relevant partner count, usually the equity partner count. It is not a salary, guaranteed payment, or amount every partner receives.
The metric becomes more informative when the market shows a wide spread between firms. The 2026 Am Law 100 average PEP was $3.59 million, compared with $12.152 million at Wachtell, Lipton, Rosen & Katz. That gap shows that “per partner profits” is not a universal market rate. It reflects firm scale, staffing model, client demand, practice mix, and partnership design, as documented in the Am Law partner-pay comparison.
Practical rule: Treat PEP as the starting point for a compensation conversation, not the conclusion.
Why the metric appears in negotiations
Managing partners use PEP to assess compensation capacity. Hiring partners use it when framing lateral offers. Candidates compare it with draw guarantees, origination credit, capital requirements, and the route to equity. Merger advisers may also review profitability measures to determine whether two firms operate under compatible economic models.
The number's visibility makes its limits important. In the 2025 Am Law 100 ranking, Kirkland & Ellis led with $9.253 million in PEP, followed by Wachtell at $9.036 million and Quinn Emanuel Urquhart & Sullivan at $8.643 million. The 2025 Am Law 100 reporting offers a market reference, but it does not show how each firm allocates profits internally.
For firm leaders, the useful questions are specific:
- Partner mix: How many partners share the equity pool?
- Economic durability: Did profit rise because of recurring demand, improved realization, lower costs, or a smaller equity denominator?
- Recruiting capacity: Does the result support competitive offers without weakening the partnership model?
- Retention risk: Are individual partners seeing the same improvement as the reported average?
A high ranking alone says little about partner experience. Leaders should test whether the profit structure is understandable to candidates, credible to current partners, and consistent with the firm's compensation rules. This overview of law firm partnership structures provides useful organizational context that a PEP figure leaves out.
How Per Partner Profits Is Actually Calculated
The calculation is simple. The interpretation isn't.
Start with the firm's distributable net income, meaning the profit available for allocation under the firm's accounting and partnership rules. Divide that amount by the applicable partner count. Published Am Law PEP generally focuses on equity partners, although firms and commentators may use different definitions when discussing all-partner profitability.
A basic illustration makes the mechanics clear. If a firm has 200 equity partners and $50 million in distributable profit, the reported PEP is $250,000. That does not mean every equity partner receives exactly $250,000. A lockstep firm, an originations-based firm, and a modified merit system may distribute the same profit pool very differently.
The denominator controls the headline
The partner count is the most easily overlooked part of the formula. If the profit pool stays constant while the equity partner count changes, reported PEP changes mechanically. A partner moving from equity to non-equity status may reduce the denominator used for PEP, even if the firm's broader compensation obligation hasn't changed in the same proportion.
Consider the same $50 million profit pool under two reporting bases:
| Partner Count Basis | Total Partners | Distributable Profit | Reported PPP |
|---|---|---|---|
| Equity partners only | 200 | $50 million | $250,000 |
| All partners | 250 | $50 million | $200,000 |
The table isn't a claim about how a particular firm reports. It shows why readers must ask which partner class the calculation includes. A firm with a large non-equity tier may present a very different all-partner economic picture from its equity-only PEP.
The definition of PEP as distributable income divided by equity partners also clarifies why the metric acts as a levered indicator. Revenue, collection rates, associate staffing, overhead, pricing, and partner count can all move the result.
Accounting choices require reconciliation
Firms may differ in how they treat capital contributions, special distributions, investment income, timing adjustments, and other items affecting distributable profit. Those choices can make two apparently similar firms difficult to compare without normalized financial statements.
A finance leader should document the numerator, the denominator, the averaging convention, and any extraordinary items before using PEP in a compensation or merger discussion. A strong CFO function in a law firm can help ensure that leaders aren't comparing a clean recurring result with a figure that includes unusual income or a one-time adjustment.
Benchmarking Per Partner Profits Across the Market
The upper end of per partner profits is highly concentrated. In the 2026 Am Law 100 ranking, average PEP reached $3.59 million, with Wachtell at $12.152 million and Kirkland at $11.121 million. In the prior ranking, based on 2024 performance, Kirkland reported $9.253 million, Wachtell $9.036 million, and Quinn Emanuel $8.643 million. The top ten firms each exceeded $6.81 million, according to earlier coverage by Above the Law.
A separate comparison reported a 2024 Global 100 average PEP of $2.43 million, while later Am Law reporting placed the average around $3.15 million to $3.59 million. The Global 100 profitability comparison supports a restrained interpretation. Market averages provide context, not a compensation target that applies to every firm, office, or practice.
Compare structure, not just position
A useful benchmark matches firms with similar economics. A global full-service firm, a high-growth litigation platform, and a regional corporate practice may differ in rates, staffing, matter duration, client concentration, and partner participation. Their PEP rankings therefore describe different operating models.
When reviewing a target firm, ask:
- Which peer group applies? Match business models before comparing rankings.
- What sits behind the margin? Examine pricing, realization, productivity, and practice mix.
- How wide is the spread? A high average may reflect a small group of unusually productive partners.
- What changed? Separate recurring improvement from changes in partner count or classification.
Ranking position can identify a firm's market tier. It cannot establish whether that tier is attainable for a lateral partner, a rising internal partner, or a specific practice group. A high PEP may also conceal concentration risk if a small number of partners or practices produce a disproportionate share of profits.
A better self-anchoring exercise
Place the firm within its relevant peer set, then measure the distance to the next economically comparable tier rather than the next name on a league table. Identify the structural feature creating that gap and test whether it is durable.
That feature might be a premium practice mix, a deeper associate bench, stronger collections, lower overhead, or a narrower equity partnership. Each has different recruiting and retention implications. High PEP supported by durable client demand represents a different platform from high PEP produced mainly through denominator management. The first may support lateral hiring and partner retention. The second can make the headline number look stronger while leaving less room for growth or compensation flexibility.
What Drives Per Partner Profits Up or Down
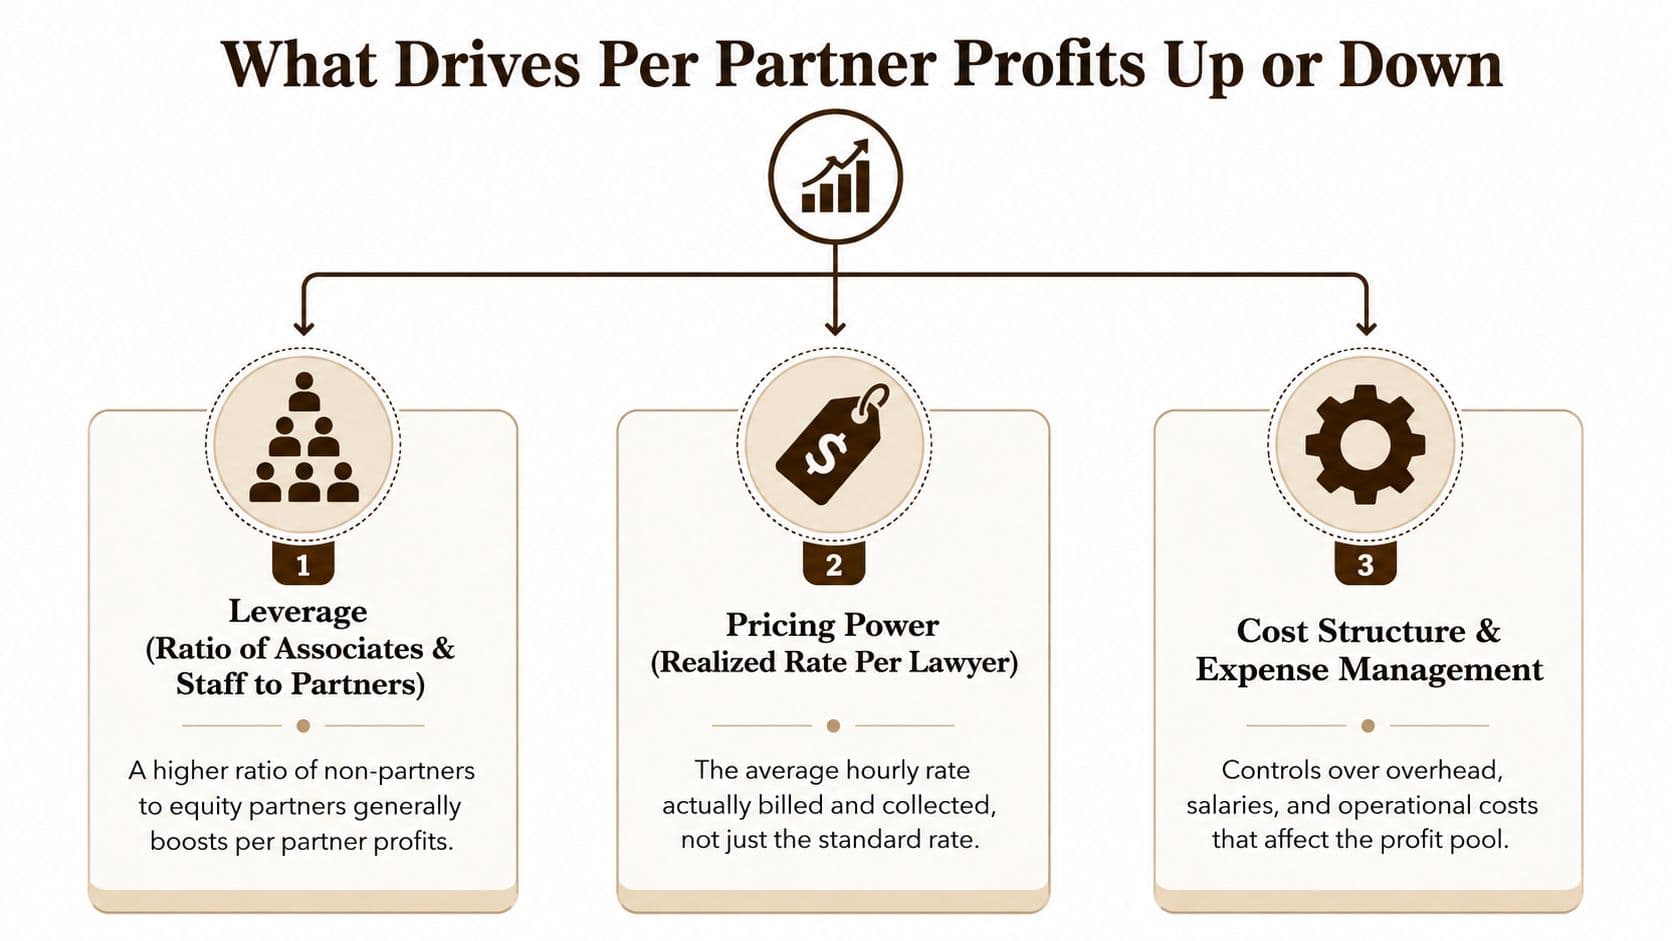
Five operating factors move PEP, but they do not carry equal economic meaning or respond on the same timetable. Treating them as a diagnostic set is more useful than treating PEP as a ranking score.
The operating levers
Profit per Partner reflects the relationship between non-partner lawyers and equity partners. More productive associates and staff supporting each equity partner can expand the distributable profit pool, provided demand, quality, utilization, and collections hold up. The staffing model therefore affects both current earnings and the capacity to serve additional work.
Pricing power appears in the realized rate per lawyer, not the standard rate printed on an engagement letter. A firm can announce higher rates yet see little PEP improvement if clients resist, write-offs increase, or collections weaken.
Practice mix changes the platform's economics. A firm weighted toward premium transactions or specialized litigation may show a different profit profile from one handling lower-priced, labor-intensive work. Mix also affects demand risk, staffing requirements, and the ease with which partners can transfer portable business.
Overhead discipline determines how much revenue remains available for distribution. Compensation, technology, occupancy, recruiting, insurance, and administrative spending all reduce the profit pool. Cost reductions can raise PEP quickly, while cuts that weaken service or retention can reduce future revenue.
Equity partner count creates the fastest mechanical movement. If the denominator contracts while profit remains stable, reported PEP rises without higher revenue or better productivity.
Rank the levers by controllability
Rates and practice mix are partly controllable over several years. They depend on client acceptance, talent investment, and business development. Expense controls usually act faster, although their effects may be harder to sustain.
Equity-tier changes are faster still and easiest to misread. Removing three equity partners from a firm with 25 equity partners would produce a reported PEP increase of roughly 14%, assuming distributable profit remained unchanged. The arithmetic shows denominator sensitivity, not a guaranteed management result. Partner-count movement must accompany every PEP comparison.
A leadership dashboard should separate:
- Economic improvement, such as stronger recurring demand or collections.
- Operating improvement, such as better staffing or expense control.
- Accounting movement, such as a changed equity denominator.
A rising PEP matters when leaders can identify which factor moved, test whether it is durable, and assess how it changes recruiting capacity, lateral compensation, and partner retention. Without that diagnosis, the number is a headline rather than a measure of firm health.
When Rising Per Partner Profits Mislead the Reader
A higher PEP does not necessarily mean individual partners are earning more or that the partnership has become healthier. The figure can rise after a firm changes which lawyers qualify as equity partners, leaving the economics experienced by individual lawyers less clear.
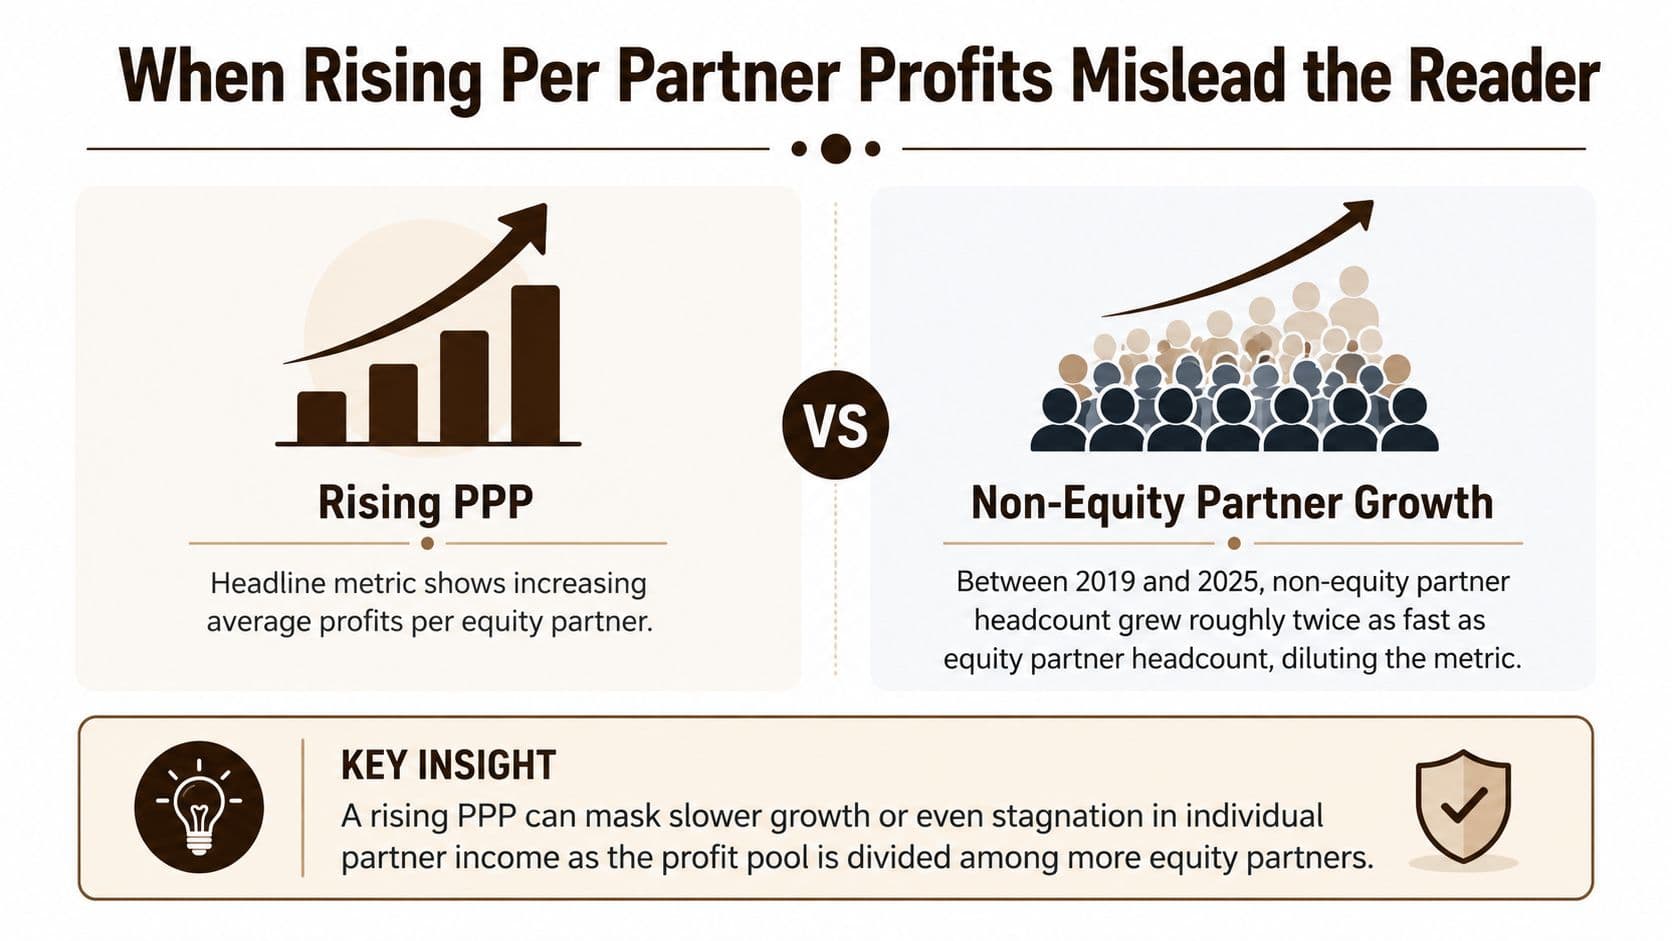
Reuters reported that PEP rose nearly 12% in 2024, with growth in non-equity partners contributing to the result, as described in its legal industry analysis. The implication for firm leadership and candidates is direct. A firm can change the balance between equity and non-equity tiers, producing a stronger equity-only average without delivering the same improvement to every lawyer connected to the partnership.
Three distortion patterns
Non-equity dilution occurs when more senior lawyers sit outside the equity pool. That structure can preserve or raise reported PEP while moving compensation obligations into another tier. The headline improves, but a candidate may face a longer or less certain path to equity.
Origination-credit reshuffling can reallocate profit attribution without increasing the firm's total cash generation. A revised credit policy may make selected partners appear more productive while creating retention pressure for others.
One-time adjustments can inflate a reporting period. True-ups, special distributions, investment gains, and other unusual items may increase distributable profit without establishing a recurring run rate.
PEP remains useful, but only when recurring operating performance is separated from a favorable accounting period.
The diagnostic question
Ask: Did the profit pool improve because the firm generated more durable economics, or because it changed the composition and allocation of the partnership?
The answer requires reviewing equity admissions, non-equity growth, partner departures, realization, and recurring practice demand. It also explains why the 2025 Am Law 100 average PEP of $3.15 million should not be treated as an individual compensation promise. The gap between the highest and lowest firms reached $8.66 million, as noted in the Reuters analysis. PEP can reveal recruiting capacity and partner-mix risk, but it cannot show either without examining how the number was produced.
Per Partner Profits as a Recruiting Signal
A high PEP can give a firm a recruiting advantage, but the signal depends on how the firm produced it. Candidates should use the number to shape questions about platform economics, not to accept a compensation assumption without verification.
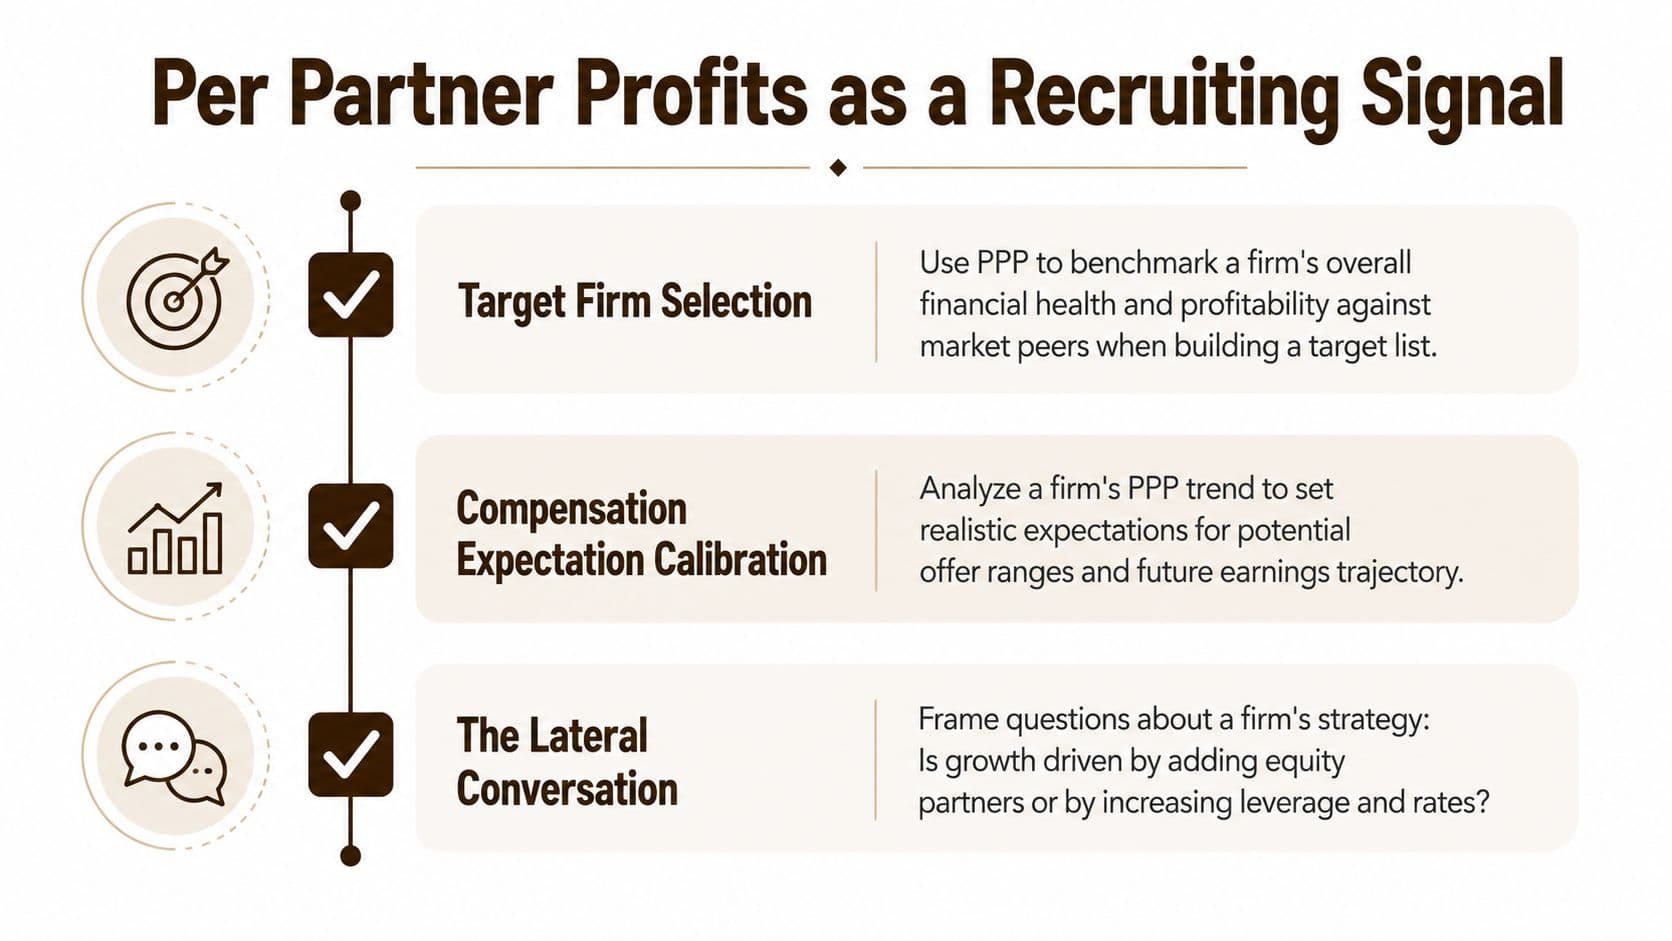
A firm with strong, stable PEP may have more room to support competitive base compensation and absorb a lateral's ramp period. A firm with a high number but a shrinking equity tier may instead be protecting a small profit pool for fewer owners. A firm with a more moderate result may offer greater mobility, faster access to equity, or a platform better suited to a portable book.
Match the metric to the recruiting decision
For target firm selection, use PEP to identify economically credible platforms, then compare the firm with peers that share its practice mix and business model. A litigation partner shouldn't evaluate a broad full-service firm solely against a specialist litigation boutique.
For compensation calibration, ask how reported PEP relates to actual distributions, guaranteed draws, bonuses, capital calls, and the compensation model for the relevant practice. PEP provides context for earning capacity, but it doesn't establish an offer range.
For the lateral conversation, focus on the source of growth. Is the firm increasing rates and demand? Is it adding profitable associates? Is it reducing equity admissions? Each answer creates a different risk profile for a lateral partner.
A firm that expects a partner to bring portable business should explain origination credit, collection treatment, cross-selling expectations, and the consequences of a client's departure. A firm offering a guaranteed draw should explain the duration, repayment terms, and transition to ordinary compensation.
Three figures to request
Before accepting a target firm's headline PEP, request:
- Equity partner count trend: Determine whether the ownership pool is expanding, stable, or contracting.
- Non-equity-to-equity ratio: Identify how much of the partnership sits outside the reported denominator.
- Average years to equity: Review the relevant practice group rather than relying on a firmwide promise.
Candidates should also ask whether the firm's PEP is broad-based or concentrated among a small group of rainmakers. The lateral partner recruiting guidance is useful here because recruiting success depends on matching a candidate's practice, clients, expectations, and culture to the platform, not just presenting an attractive league-table result.
Reading Per Partner Profits in Due Diligence
A lateral partner should not judge a firm from one year of PEP. The first diligence request should cover the firm's full PEP series, with the equity-only and all-partner counts used to explain changes.
Build a normalized view
Ask finance or recruiting leadership to reconcile five points:
- Profit definition: What income enters distributable profit, and which unusual items were included or excluded?
- Partner denominator: Does the figure use year-end or average equity partners?
- Revenue productivity: How does PEP compare with revenue per lawyer and the firm's staffing model?
- Concentration: Does a small group of originators produce a disproportionate share of the profit pool?
- Partner movement: How have additions, departures, lateral hires, and internal promotions changed the platform?
These questions turn PEP from a ranking into a diagnostic. A firm with strong PEP that depends on a few rainmakers carries a different retention risk from one with results distributed across practices. Heavy reliance on lateral growth also creates a different risk profile from steady internal promotion, particularly for a candidate assessing future partner supply and client continuity.
Read the compensation architecture
Request the partnership agreement or a clear summary of its economics. Identify whether compensation follows lockstep, modified lockstep, eat-what-you-kill, or a hybrid approach. Review deferred compensation, capital contribution requirements, draw mechanics, special distributions, and post-merger obligations.
PEP indicates what the firm can produce at the reported average. It does not show what the candidate's role will receive, when payment will occur, or what capital participation requires. The analysis should connect the average to expected practice performance, client portability, admission path, and exposure to firmwide risk. A high PEP may provide a recruiting advantage, but it becomes persuasive only when the compensation system gives the candidate a credible path to participate in it.
The decision test is straightforward: if the firm cannot explain PEP movement through partner count, recurring profit, practice mix, and compensation policy, the figure is not ready to support a lateral decision. A candidate should treat that unexplained gap as diligence risk, not as evidence of upside.
Turning Per Partner Profits Into a Strategy
Managing partners should replace the annual PEP ranking ritual with a recurring management review. The objective isn't to maximize one headline number. It's to maintain a defensible profit range that supports service quality, partner compensation, talent investment, and future admissions.
Set a target PEP band that fits the firm's practice mix and cost structure. A specialist litigation platform shouldn't copy the target of a global firm, and a growing regional partnership shouldn't protect a high average by eliminating the equity path that attracts ambitious partners.
Connect the band to operating decisions
Review four areas consistently:
- Pricing governance: Track realized rates, collection behavior, write-offs, and client resistance by practice.
- Origination policy: Test whether credit encourages collaboration, succession, and durable client relationships.
- Cost per lawyer: Separate productive investment from overhead that doesn't improve delivery, retention, or business development.
- Equity admissions: Set transparent thresholds for ownership, contribution, performance, and long-term platform value.
A decline in PEP should trigger diagnosis before compensation cuts. Leaders should test practice demand, pricing, realization, staffing, partner departures, and unusual accounting items. Conversely, a sharp increase should prompt the same scrutiny, because a smaller denominator or one-time gain may create a misleading sense of security.
Put the metric in recruiting materials
Candidates should see realistic economics, including the distinction between non-equity and equity compensation and the conditions for advancement. A firm that explains its PEP range, partner-class movement, and growth assumptions earns more credibility than one that presents a single peak figure without context.
Finally, stress-test the plan against a slower rate environment, a major client loss, and an increase in lateral demand. If the target PEP only works when rates rise, a rainmaker remains, and equity admissions stay restricted, it isn't a strategy. It's a favorable scenario.
The best leadership question is simple: does this PEP result give the firm more capacity to invest in people, or does it merely make the firm look more profitable on paper?
Five Star Placements provides permanent placement for attorneys, partners, legal support professionals, in-house counsel, and legal operations leaders, with searches customized to practice needs and organizational culture. Visit Five Star Placements to discuss recruiting or hiring support that connects per partner profits with practical talent decisions.
Need help filling a legal role?
Five Star Placements partners with law firms and legal departments nationwide.
Schedule a Call